Problem Solving
The most common problems when using SVP are the following:
- SVP does not "see" (detect) the video being played back.
- No improvement in the smoothness of the video; the image is jerky and teared. To verify whether playback is smooth, turn on the Fluency and tearing test option in the Utilities submenu of the Main Menu. In this mode, a moving vertical orange bar is displayed over the video. Freeze-frame movement of the bar indicates a problem.
- Instability of the video player operation or the entire system operation, system crash.
To solve a problem, perform the following actions in the specified order:
- Make sure the video player is configured correctly. Read the instructions on configuring your player in the Information → Video player configuration submenu of the Main Menu.
- Make sure the system has sufficiently high performance for the selected profile options. See the Monitoring the Performance section.
- Make sure the video drivers are installed correctly. For this, use the OpenCL devices and capabilities option in the Information→ Additional information submenu of the Main Menu. The information about the OpenCL subsystem will be displayed.
- Make sure that both CPU and GPU are not overheated when the frame rate conversion function is on.
- If you use a 32-bit player in Windows, make sure you enabled "4GB aware patch". To do this, select the Apply 4GB aware patch option in the Utilities submenu of the Main Menu. Selecting this option launches a utility that modifies the executable (.exe) file of the 32-bit video player to enable it to use up to 3 GB of RAM. This prevents crashes of the player in the process of playing a Full HD video or larger. Before you perform this modification, you must close the player.
- Check the log for errors (see the Events log section).
- Read the FAQ on our website.
- Contact SVP Technical Support (see the Providing a Feedback section).
Monitoring the Performance
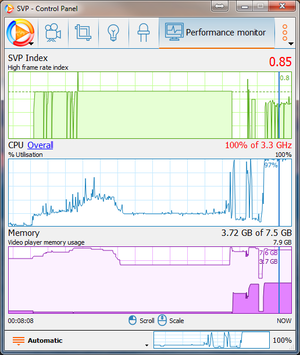
The performance graphs show the current system load and the stability of the FRC function. To quickly evaluate the CPU load, use the minified versions of the two graphs (CPU utilization and SVP Index) at the bottom of the Control Panel window. Left-click on it to switch to the other graph.
To view all available performance information, select Utilities → Performance Monitor from the SVP Main Menu. The Performance monitor section of the Control Panel opens.
The values at the current moment (NOW) are shown at the right edge of the graphs and over time are shifting to the left. Graphs can be scaled up or down (by scrolling the mouse wheel) and shifted (by holding the left mouse button) in time. The thick lines at the right borders of the graphs indicate the shift from the NOW moment.
SVP Index – this graph shows the ratio of the achieved frame rate to the target value that should be close to 1.0. The acceptable deviation should be within the following range: -0.05...+0.1. A value less than 0.95 means that the system performance is too low to perform both new frame calculation and their rendering.
For example, for a video with a frame rate of 25 fps after its frame rate is doubled, 50 frames per second should be displayed on the screen. If the system is able to calculate or render only 40 frames per second, the SVP Index will be 40/50 = 0.8. In this case, you need to review the options used for calculation or rendering frames (see the video output settings in the video player).
CPU – this graph evaluates the CPU load, in percent. Double-click the graph to view CPU per core usage.
In addition, the graph can show current CPU frequency (in orange). This allows you to diagnose problems related to overheating. The graph of the current CPU frequency is displayed only in Windows 8 or later and macOS. For macOS, you should also install the "Intel Power Gadget" package.
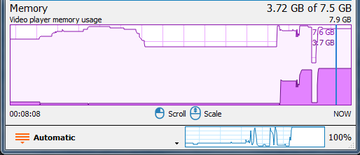
Memory –- this graph shows the memory usage (the light-violet line)
Additionally, during video playback, the dark purple line shows the usage of memory by the video player process. If a 32-bit player uses more than 2.5 GB of memory, its operation can become unstable and result in closure due to errors.
Events Log
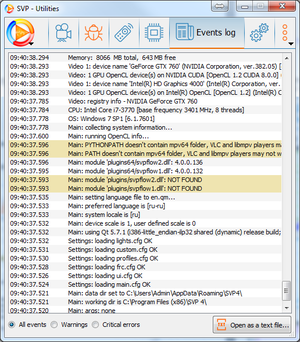
SVP generates a variety of information messages. If any problem occurs, you should check the log for errors.
To view the log, select Events log in the SVP Main Menu. The Events log section of the Control Panel will open.
Newer messages are at the top of the list.
Some messages are highlighted in colors that indicate their importance: "warnings" are highlighted in yellow, while "errors" are highlighted in red.
To copy messages to clipboard, select several consecutive messages with the mouse, press the right button and select Copy. To open the entire log as a text file, click the Open as a text file button.
Providing a Feedback
If you did not find a solution for your problem in this document, please contact SVP Technical Support. We are trying to respond to all requests, however, in some cases you can get a quicker response at SVP forum.
To contact SVP Technical Support:
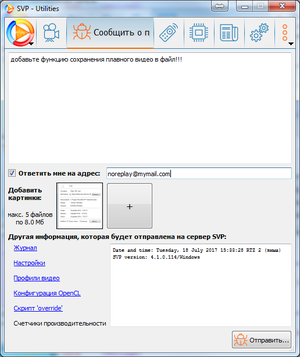
- Select Information → Send problem report in the Main menu. The Report a problem section in the Control panel will open.
- Describe your problem or suggest an improvement for SVP (preferably in English).
- To receive a response from the Technical Support Service, select I'd like to get reply to and enter your email address.
- If needed, add any relevant screenshots and other images that could help explain your problem (up to 5 files).
- Click Post report.
When you contact SVP Technical Support Service, no confidential data is transmitted. Any request contains only the following data:
- program start log;
- program configuration;
- video profiles list;
- list of installed components;
- information about the OpenCL graphics subsystem;
- the texts of the JavaScript "generator" in case it was modified;
- performance counters listed in the "Monitoring of performance" section.


